
CONFIGENA

The Art of Decision Making
Decision‑making is not a single act but a structured process. It combines clarity, system awareness, and the ability to navigate uncertainty. The Art of Decision Making is about understanding how choices emerge, how they interact with complex environments, and how they shape outcomes over time. This website is dedicated to Project Configena.

What the Blog will cover
Hi there. I’m Lilu, the CLAO of Configena — the Chief Logic & Advisory Officer.
Let me introduce you to the Configena blog. Currently, it’s still pretty empty. I promise you, that more content will be added very soon 😀. So stay tuned!
This blog will explore the the principles of Systems Thinking, behavioral patterns that shape decisions, and the model-based approaches that help to understand complex choices and product development. The focus however, will be news about the development of the Configena framework.
In my immediate neighbourhood lives a young family with a now four-year-old son. They speak the local language and, at home, also maintain the language of their country of origin. Learning languages comes with its challenges. And despite all the advantages of growing up multilingual, it certainly doesn’t make those challenges any smaller. A circumstance I can observe in the little one almost daily.
In fact, the two of us have found a way of communicating that goes beyond purely verbal expression. Alongside — as it seems to me — expressions that are entirely our own, it is based on appreciation and a kind of symbiosis. No, my office does not contain posters or coffee mugs from Paw Patrol. Even my appreciation has its limits. I stick with Sesame Street. The word symbiosis is chosen quite deliberately here. On one side, the urge to explore the world; on the other, the joy of sharing what one has discovered oneself and of providing orientation. Here, the desire to climb trees, ride a BMX over a track and do jumps, or leap off a swing — and there, the instinct of a four-year-old who is not yet, like a late adolescent, willing to inflict pain on himself. Feelings, longings, and instincts meet reason with forward-looking considerations and deliberate action. The actual symbiosis arises when one does not experience reason as a pure counterforce to one’s longings, but as a tool that can be used deliberately to enable those longings — without a subsequent stay in the emergency room. In short: I like tinkering and building, he likes playing and romping. Fits.
One of the things that seems to spark his greatest enthusiasm is water — whether as a space to play in or as a means to play with. So next on the agenda is the realization of a functional as well as decorative water‑play wall for the garden. More on that perhaps later in a separate post. As I have been told, the concept of appreciation on the part of a child temporarily loses significance rather quickly when it stands in the way of their own interests. Put differently, the little one seems to possess a remarkable persuasive power over his parents when it comes to things he wants. He therefore owns an entire arsenal of toys with which one can either spray water or which are used in the paddling pool or bathtub. To the latter, a bath squirter — a kind of rubber duck — was recently added. When he and his mother returned from shopping and I happened to be in the garden, he ran straight toward me to proudly show me his newly acquired treasure — though not without expressing his displeasure about a decision his mother had made.
As I then learned from his mother — and could have guessed — he naturally wanted to test the new toy immediately, which, given the time of day in the afternoon, collided with his mother’s plans. An afternoon bath did not really fit into her concept — whereas her “no” did not fit into his concept.
And as with all good conflicts, there are only two possible approaches to resolution: a) mutual understanding, and b) the right of the stronger. I already mentioned his persuasive power, and so strategically only understanding remained. So, I offered myself as a mediator.
Understanding comes in only three forms:
- the trade form,
- the empathy form, and
- a mixed form.
The trade form represents the typical compromise in which both conflicting parties receive something in exchange that they personally consider equivalent in value in a fair trade. Both parties gain something.
The empathy form works without such an exchange and consists of renunciation; in return, there is nothing. Simply put, it is based on understanding the other party’s situation and empathy.
In the last form, the mixed form, there is also a trade, but one that, from the outside, would not be considered fair. One party gives more than it needs to, but may gain socially from it. To what extent genuine or strategically used empathy underlies this cannot be determined from the outside, and in fact it can be both simultaneously. I would say that with a small child, the last form — fortunately — plays no role.
Mutual understanding simply requires understanding — regardless of the form. His mother did not buy the rubber duck as a proverbial carrot to coax him into something and then withhold it. The problem was the little one’s lack of understanding of temporal sequences. As with the Kakapo in the previous blog, it was a communication problem. The content to be conveyed was not to tell him he may not. It was to explain that he could only play with it later if he did not pre‑empt puberty now and rebel.
Since I had time and wanted to make the whole thing more attractive, I intended to suggest playing ball or something else with him for the moment.
But that alone would not solve the problem of understanding the concept of sequences. Here, the limits of nonverbal — symbiotic — communication quickly became apparent. So, I had to find another way. I came up with the following idea: “Simply” create a sketch! Here is the result:
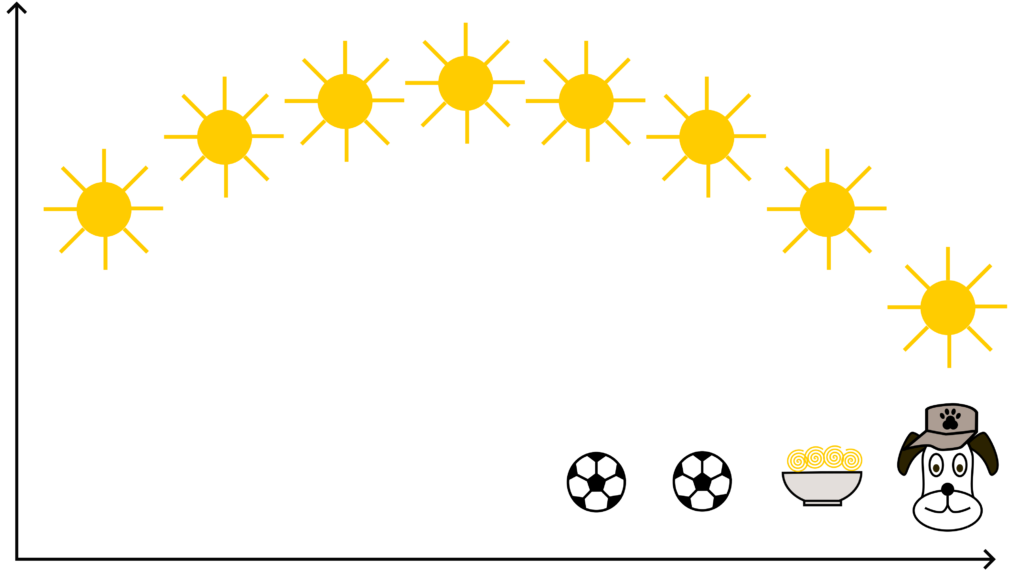
Obviously, this is not the original sketch or an image of it, but a digitally recreated version. Lilu said I should rather consider attending a drawing class than a course in operant conditioning. I don’t have it easy, but I do have my pride.
I hope there are some readers who can recognize or at least guess the meaning of the sketch even without explanation. The initial situation summarized:
- Summer with time spent in the garden under a cloudless sky.
- A four‑year‑old whose verbal communication in the language familiar to me is very limited. He cannot yet read, let alone write.
- The possibility of pointing directly at things in the environment and thus establishing relationships.
- No tower clock with hourly chimes within earshot, and the last night watchman has long since shuffled off this mortal coil without the position being refilled.
- No analog clock in use.
- The rubber duck is a bath squirter from Paw Patrol merchandise.
I should add that the original sketch was monochrome and created in his presence. It was not a flipbook, but in a sense animated.
Limits of Early Semantics
Time is a concept, and concepts are ultimately nothing more than mappings of relations. Lilu says I’m having another one of my philosophical phases, though it is not meant to be philosophical at all. In this specific case, it is about connections — relations — to familiar sequences in the form of events. Time thus becomes non‑abstract, because it is linked to one’s own experiences and observations that follow recurring patterns. Anyone who believes it is not abstract need only consider the different interpretations of the meaning of the word “punctual” as used by Deutsche Bahn compared to the SBB in Switzerland — and, if one wishes, add the Argentine version unos minutos. Even the terms now and later become relative.
It is precisely this relative — the relation — that the sketch is about. I do not know the little one’s personal routines, insofar as they are shaped by his parents. But every child grows up with sunrise and sunset, and he is therefore familiar with them. The sketch, however, does not show the image associated with sunrise and sunset as found on postcard motifs. It shows a sequence of different positions of the sun. Presumably, any reader — no matter on which continent — will be able to interpret the sketch within the given context. But what about children who cannot yet read or write?
Without thinking about it intensively in that moment, I had drawn a coordinate system into the sketch. Unlabelled, but unmistakably a kind of coordinate system with two orthogonal axes and a cross at the lower left edge of the image. Just as naturally as I did that, a viewer will usually — subconsciously — interpret a reading direction in which the past is arranged on the left and the future on the right. But this is a purely culturally shaped convention. A small child is not yet familiar with these conventions.
Can this sketch even work? Yes! Not because the convention is innate, but because the image does not explicitly require time. Alongside time, the sketch carries another concept — that of space. The sketch has not only a top and a bottom, but also a left and a right. The height of the sun depends on location, and time is represented indirectly through it. From the seating area in the garden, the sun is on the left in the morning, in the middle at noon, and on the right in the evening. This works for the northern hemisphere. For a child in the southern hemisphere, one would have to mirror the image along the vertical axis. For a child at the equator, it would not work this way: the sun does change its height, but it does not travel across the firmament — it remains in a single cardinal direction. Instead of arranging the associated events — symbolized by footballs, a bowl of spaghetti, and the dog’s head — beneath the sun’s positions or alternatively above them, one would have to place them to the side, making the relationship easily recognizable.
The problem would be that morning and evening could not be distinguished. They would overlap. So, there would be no choice but to enrich the sketch with additional information in order to differentiate between morning and evening. Instead of one sun, two placed next to each other, possibly with two colors or hatchings: one for morning and one for evening. The level of abstraction would inevitably have to be increased. This demonstrates how strongly, even for a familiar context, understanding is not an invariant but depends on perspective — and how it can simplify or complicate something.
The explanation using the sketch is, functionally speaking, a mapping of the relation between two events through a geometrically identical arrangement relative to one another. The intended interpretation presupposes that the depicted representations are recognized and understood accordingly. The chosen form of the sun is likely interpreted in the same way across cultures worldwide. As a reminder, the original sketch was monochrome; the sun was not yellow but consisted simply of a circle with “rays.” Yet, except under very specific circumstances — such as dust, shadow, or clouds — one does not actually see “sun rays.” The chosen form of depiction therefore possesses a higher level of abstraction than one might generally assume. One should not conclude from experience that the interpretation is as self‑evident as it appears. Other depicted objects are not culturally determined but situational and defined purely by context. One may recognize the dog’s head in the example, but that it stands for the “rubber duck” is known only within a specific circle of people. Added to this is another abstraction: namely, that different times are represented simultaneously within a single image. For an adult, this concept is not unfamiliar, though it also has its limits in which it works. For a child, understanding likely does not arise from the sketch alone but is actually tied to the temporally scaled process in the form of animation — that is, the creation of the sketch itself.
Another point usually comes into play, one that goes beyond the animation itself: the connection to one’s own actions — in short, to playing. “Proper” play was not involved here, but something that corresponds to it. For all the downsides smartphones can have for children, mine has an app that shows the position of the sun and is designed as augmented reality. You point the camera at the sky, and the projection of the sun’s path appears superimposed. Where the sun is at that moment, a yellow circle is displayed. The act of orienting the smartphone corresponds, so to speak, to the playful action.
From Signs to Meaning: The Semantic Chain
Meaning does not arise from the representation of information alone; it emerges only within the processing system that receives and interprets that information. One could delve deeper into these matters here and pursue questions such as whether a specific perspective on the firmament may have influenced culture and, for example, the development of writing systems. But that is not the focus here. In fact, all so‑called high cultures that produced writing systems are located in the northern hemisphere. If thinking takes place within the space of meanings, the example illustrates very clearly that, at the first level, it does not occur independently of perception and context — yet through the process of abstraction, it can detach itself from them.
In the previous blog post, it was already indicated that the concept of semantics will be examined in greater depth and will appear repeatedly in the blog. It was not discussed at that point and was implicitly equated with meaning. In the concrete example of the preceding post, the issue was that the Kakapo would need to choose a different form to convey its message to a potential mate in order to reduce the risk of being eaten by a predator. The term semantics is shaped by its use in linguistics and describes the study of the meaning of signs. It examines how words and composite expressions acquire meaning. Explaining one term by means of another that itself requires further explanation seems of little use. If, as just shown, meaning arises only within the processing system — in the mind of the observer and listener — then it would not be invariant. I therefore want to offer my own description of the word semantics, one that subsumes the common usage but is at the same time more precise. In fact, the overarching term is semiotics. It distinguishes between semantics as the relationship between signs and their meaning, and pragmatics as the relationship between signs and the how through which they acquire meaning — thus indirectly between the signs and their users.
Some readers may slowly begin to wonder at this point what all of this has to do with systems thinking and modeling approaches. I can say: an extraordinary amount. And that is what we will turn to now.
If one does not come from the field of linguistics, language is, in fact, nothing other than a model. Fine. Then the question arises: What is a model? A term that is used as a matter of course, yet applied in very different ways and conceptually covers different things. Mathematically — even if perhaps somewhat informally rather than strictly following the principles of the Principia Mathematica — one may consider two separate sets of entities. The entities themselves may also be relations between entities of the same set. If there is now a relation — a mapping — that links each entity of set B to an entity of set A, one could call B a model for A. This mapping, meaning the totality of all relations from A to B, does not need to be bijective; surjective is sufficient. In short: not everything in A must have a counterpart in B for one to speak of a model.
This definition given here is free of ambiguities. It is unambiguous. What happens now is that the mapping — the totality of all relations between the two sets — is itself also referred to as a model. This becomes even clearer when one considers only a subset A′ of A and thus extracts the totality of the involved relations from A′ into the corresponding subset of B, B′.
Linguistic differentiation is not sufficient here. The set of relations itself is, in fact, also referred to as a model. But there is no isomorphism between these two sets. Surjectivity does not exclude the possibility that two or more entities from A map onto a single entity in B.
And that is not all: the term modelling — the process of forming a model — is not “just” ambiguous, but practically has three meanings:
- Identification of B — the identification of the totality of entities in B, or B itself.
- Capture of relations — the capture of all relations from A into B.
- Instantiation — the formation and application of the subset from A to B, essentially the instantiation.
With this, the pitfalls in the use of the terms model and modeling have been worked out. Now an additional level of abstraction is added: the subset was mentioned. It itself again forms an entity. A set of subsets is therefore also a set of entities. Thus, it can itself again be a representation — a model — of another set, which may be disjoint from the previous sets. In this way, a metamodel emerges. This principle can be continued arbitrarily.
Thus, back to the term semantics as it is understood here. It is not limited to the final mapping of meaning assignment. It encompasses a chain of mappings:
- from reality as a set of entities with relations in space and time,
- through a physical form of representation — whether pure visualization, sound, animation, or enaction,
- through perception as a layer of translation,
- up to the assignment of meaning.
Each of these can be represented according to the implicitly introduced concept of metamodeling. Semantics therefore links five distinct model spaces — from reality all the way to interpretation!
Whether one is attempting to convey to a four‑year‑old events and sequences tied to temporal concepts by introducing astronomy, or an ethologist undertakes the effort to acquaint a dog with the use of a flush toilet, it is always the chain of mappings that determines success or failure. Or, more precisely, it is the adequate conception of the members of that chain that should, if necessary, prevent one from choosing this path.
Transition to Product Management
Turning now to the topic of product management — without losing sight of the fate of the kakapo, my little neighbor boy, or all the ambitious ethologists in the world. Since a picture is known to say more than a thousand words, it is understandable that the use of diagrams is common in order to illustrate a role in relation to others, or the tasks associated with it, in this form. This also applies to product management and to the product manager as a role. If one uses an internet search engine to display depictions of product management, one could easily come to the conclusion that the only task of product management is to place itself at the center — as if doubts about its own importance existed that must be dispelled again and again for all to see.
One may recall the previous blog post, in which the placement of product management was, on the contrary, located only at the beginning of a product life cycle and not at its center. In fact, an additional clarification is needed here, which will be addressed later.
The observation just expressed is not to be understood as criticism of product management, but rather as an expression of disillusionment that even those entrusted with the role do not seem able to explain their own position more clearly. Instead of dwelling on criticism, the aim here is to develop images and diagrams of my own, with the ambition of doing it better — more than a depiction, a model of product management.
To begin, a concise definition of what product management is, when one consolidates various explanations:
Product management is the continuous, responsible steering of a product throughout its entire life cycle.
Various descriptions sound more or less like this. Depending on the emphasis, they include different discussions of the life cycle, the stakeholders involved, or the surrounding conditions.
Presumably anyone who has already dealt with the topic of product management, or is themselves a product manager, will be able to agree with this short definition. Nevertheless, it is a very peculiar formulation — one that does not yet amount to a tautology, but should actually prompt some frowning. For comparison, imagine asking a bus driver of a local transport company what he does for a living, and receiving the answer that he steers a bus through the entire city area from one end to the other. Certainly not wrong. But in my mind, this produces the image of a bus wandering aimlessly, appearing here and there in the city — similar to the legendary Flying Dutchman on the sea. One can only hope that the bus driver does not also intervene operationally and rearrange the traffic lights and road signs.
Product Management as a Steering Problem
Product management is embedded in corporate strategy. Only when a corporate strategy is in place can product management take place at all — and not the other way around. It determines the direction in which steering is to occur. The bus driver steers according to a timetable on a fixed route. What the route and timetable are for the bus driver, corporate strategy is for the product manager.
Before we turn to the question of how corporate strategy sets the direction, let us stay with the analogy of the bus driver. Just as the bus has two steering dimensions — steering and propulsion — there are also two ways to steer in product management:
- via product design (product portfolio, product features)
- via communication (marketing, sales)
Product management neither conducts marketing and sales itself, nor is it involved in actual product development, including modularization strategy. Rather, it sets the framework conditions. The role is not operational but coordinating and communicative. In the analogy with the bus driver, the driver does not propel the bus like Fred Flintstone with his feet on the ground — like a hamster in a wheel — but instead provides a steering signal via the accelerator pedal.
The following depiction shows the role of the product manager, or of product management, within the functional view of the organizational units. It explicitly says nothing about organizational structure or its hierarchies. It illustrates the core interactions within the company. Parallel to this, the associated assets can be captured in a diagram. Building on the previous blog post, the segments of the enterprise software can additionally be represented in a further depiction.
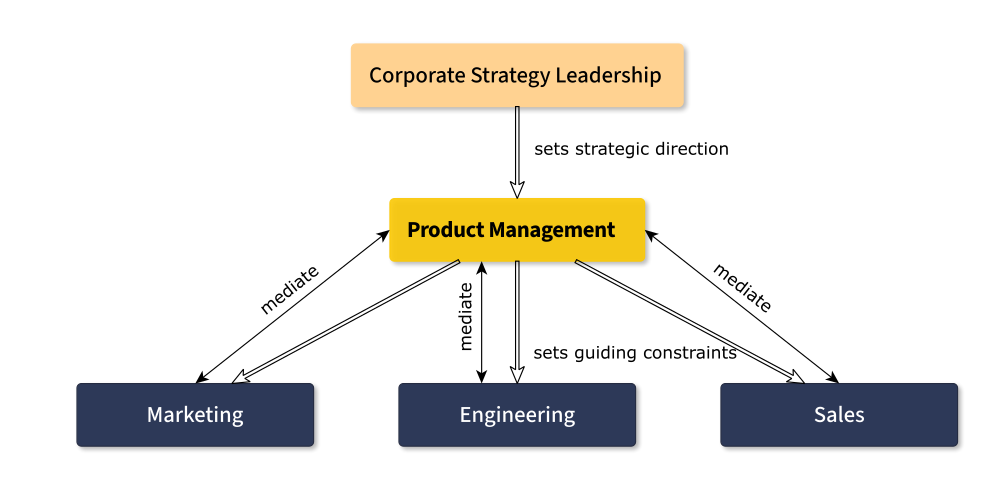
Product management not only sets the boundaries for product design and product communication, but it also mediates. The product manager is a communicator who translates the strategic directives of corporate leadership into the outward‑facing areas of marketing and sales, as well as into the engineering areas concerned with technical implementation, and at the same time connects the three corporate domains.
The flanking role of product management would likely be affirmed by most product managers. In the mediating role between the functional organizational units, some may begin to have doubts — especially since this discussion has been about product management and not a single word has yet been said about markets and customers. Patience, esteemed readers. Just because one is accustomed to a path of peaceful coexistence with a symbiotic communication style does not mean that it does not have its limits — which brings my neighbor’s boy back into play.
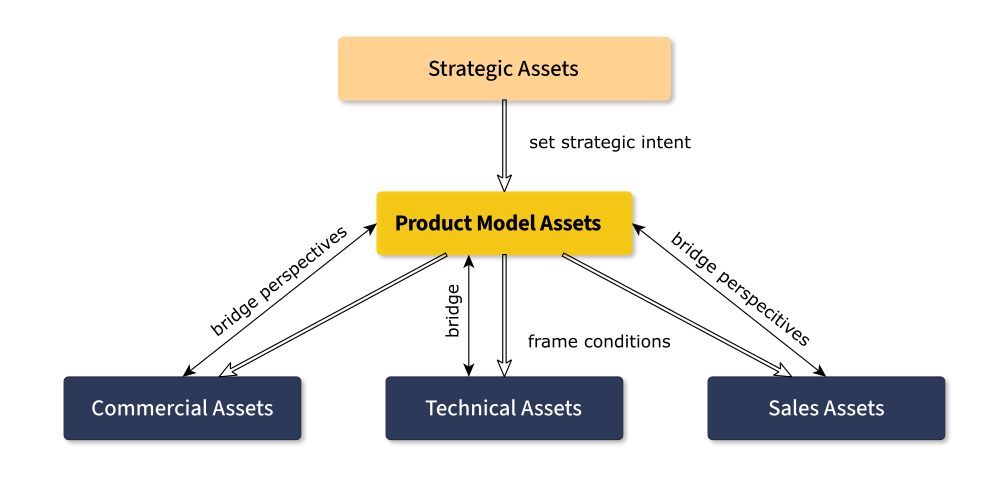
Let us first look at one of the dual representations which, admittedly, is of little help in its given form. Therefore, a few more concrete examples follow below. The lists are neither complete nor particularly systematic.
| Engineering | Sales | Marketing |
| System Architecture (Diagrams) Specifications (Requirements Documents) Bill of Materials (BOM) System Models | Price Lists Customer Database Sales Proposal Documents CPQ Logic in the Sales System | Campaign Plans Product Brochures Landing Pages Core Messages and User Value Arguments |
| Product Management | Executive Leadership |
| Product Vision Product Positioning Value Proposition Product Narrative Intentional Roadmap Market and Customer Insights Business Case | Guiding Principles Corporate Strategy Portfolio Strategy Market Segmentation Target Customer Definition Pricing Strategy |
For discussing product management as a mediating role, let us briefly insert another intermediate step and consider the guiding principles of a company, for which corporate leadership is responsible. They should — hopefully — require no translation. In terms of content, they are known to all employees. Yet in practice, they have no relevance in everyday work. Virtually no action or activity requires a prior check against the guiding principles. It simply does not occur. The only exception might be job interviews, but even then, usually only in a rudimentary way. Building on the example of the four‑year‑old, it was previously explained how meaning comes about and how the term semantics is understood here.
But as long as no one asks about the meaning — as in the case of guiding principles — they simply do not have any. Just because they are known in terms of content does not mean that they acquire meaning in one’s own actions.
Characteristic of the guiding principles in question is that they are, in effect, unchangeable. They may be modernized and can change in the context of business acquisitions, but otherwise they remain as they are. They are part of the company’s identity. Accordingly, no decisions are pending in this regard — neither concerning the guiding principles themselves nor concerning actions derived from them. Only in the case of major upheavals might the question of alternatives arise.
Precisely with the question of alternatives, considerations and statements acquire meaning. First, in identifying alternatives, and then in weighing decisions in which various dependencies must be taken into account. For the guiding principles, these dependencies are only implicit. For the others, they are explicit — or should be. They are made in cycles of varying length: some after an entire product cycle, others much earlier, such as after the duration of product development, or after other time intervals.
Many — if not most — are not externalized, meaning the decision‑making process is not documented. If the documentation effort were just as large as that for development or production, then in most cases the time would have come to change the way of working — or to consider a different corporate form, such as a publicly owned combine.
On the other hand, today the documentation effort for many companies is already high due to certifications and approvals. Perhaps it is more a matter of form. An adequate form of representing decision‑making processes can help respond to changes in the conditions that originally justified a decision — without having to run through the entire decision‑making process again. It would, if necessary, be enriched, the selections adjusted and of course reviewed — but without starting from the beginning.
In cases of staff turnover, it would even be part of internal knowledge management.
The definition of product management that I have assumed — and that any product manager could agree with — includes continuity. If not, I refer again to the previous blog entry: it would be a position that could be rationalized away due to lack of workload.
In short: the continuous adjustment of decisions — steering — is the essential characteristic of product management.
And before we turn to the question of what an appropriate form might be, and where the mediating role comes into play, this is the point to return to the earlier remark that the picture of the product manager in the phase assignment within the product cycle must be completed: The handover points, where an exchange between functional organizational units takes place, exist not only within the phases of a product cycle, but also from cycle to cycle — so that product management has more points of connection and thus includes sales.
Behavioral Economics in Product Design
When we speak here of the form of representations, this leads us back to the term model. And just as in the earlier example of language and semantics, the term model goes beyond 3D representations and simulation models of physical‑technical behavior.
Some may have worked in sales in the past, or have recruited supporters as volunteers for a nonprofit organization, and have been trained in a personality model as part of such training. I say one, because there are several, all of which follow a similar core approach. For everyone else, the model is reproduced here:
One assigns various character traits to a personality. Each trait can be weakly or strongly pronounced in a person, or exhibit the opposite trait. These character features are arranged along intersecting axes, with their degrees of expression ranging from strongly pronounced to weakly, or pronounced toward the opposite.
One of these models, originating from personality diagnostics and used in sales training, uses closeness and duration as axes. Arranged orthogonally, four quadrants emerge in which a personality can be located.
Other models include, for example:
- The Riemann–Thomann model. It uses closeness and distance as well as duration and change — which ultimately are only the expressions of the traits in the model just described. It forms the original model for the quadrant division.
- DISC (William Moulton Marston) uses no axes in the geometric sense and names the character traits dominance, initiative, steadiness, and conscientiousness.
- MBTI (Myers–Briggs Type Indicator) by Katharine Cook Briggs and Isabel Briggs Myers uses the axes introversion / extraversion, sensing / intuition, thinking / feeling, and judging / perceiving.
In addition, one should mention the communication model by Friedemann Schulz von Thun. It is not a personality model, but a model of communication spaces. Its dimensions are the factual level, the relationship level, self‑revelation, and the appeal.
If the space of different expressions used to describe a personality is in each case sufficient to capture it completely, so to speak, then these different characterizations would have to be transferable into one another. In mathematics, one would speak of a coordinate transformation. In short, a translation is required in order to grasp the meaning. Here, we are not even dealing with different domains such as engineering and marketing, but with the same domain. A mediator is required.
One might assume that people belonging to the same domain are also trained in different perspectives, but this can no longer be expected when they belong to different domains.
This blog entry does not aim to become a sales training, which is why the details are not discussed further. Even without them, however, it should be clear even to those who are hearing about these approaches for the first time that it is not the goal of sales to conduct a documented personality test with their customers for statistical purposes — ideally even with a multiple‑choice test that every customer has to fill out. The goal is rather to choose, or adapt, the communication strategy for the customer based on the personality that is to be identified.
Even in its abstract form, this is the communication model by Friedemann Schulz von Thun. It is not only a mapping within a single domain, but between different spaces: from the space of personality traits into the space of communication strategy.
One could describe this, in generalized form, as a mapping from the empirical space into the decision space. The formulated model is therefore already a model, but not yet a technically practicable model form. We will arrive at that form later, and in more detail, in the next blog entry.
Let us now return to the product manager. The two steering dimensions — product design and communication — span the space of his decision spaces.
Therefore, let us examine his steering dimensions, or decision spaces, more closely and first focus on those of product design. The following table indicates the possible decision spaces for product design. The decision paths run from portfolio to product and from product to features, moving from left to right. Time is orthogonal to this. Thus, a decision can be made for a short‑term, medium‑term, or long‑term period. The listed decision expressions are chosen representatively and are not further specified.
The decision expressions can be regarded here as alternatives. Equally, expressions would be possible in which, instead of a decision point, a kind of branching point is indicated that can possess multiple expressions.
| Product Design | ||||
| Portfolio | Product | Features | Feature | Time Horizon |
| Reduce Maintain Expand | Discontinue Maintain Add | Reduce Maintain Expand Consolidate | Deselect Select | Short-term Mid-term Long-term |
While in the sales example a mapping from the empirical space into the decision space takes place, such an empirical space is missing here so far. Here, instead, we are dealing with mappings between different decision spaces. Just as in the sales example, we are indeed speaking of mappings between spaces — without naming them in detail. One possible type consists of logical connections. For example, choosing portfolio reduction would necessarily result in discontinuing one or more products. If one imagines the product space, in the simplest case, as a list of products, then starting from the decision expression reduce portfolio, there would be a relation of the type “requires any” to each individual product. In other cases, it is more complicated and additional conditions exist.
The space of features per product and the space of products within the portfolio form the framework for the engineering department and one of the foundations for marketing and sales. Each organizational unit has its own perspectives and follows its own rules. The framework therefore has different effects. The relationships between these perspectives constitute precisely the translation. This is where the mediating role comes into play. The translation does not occur directly between the perspectives of marketing and sales, or marketing and engineering, but through a higher level of abstraction located within product management.
Just as with linguistic languages, the perspectives are not isomorphic. Just as certain expressions in one language have no equivalent in another. Hence the path through the higher level of abstraction. Even in cases where there is no one‑hundred‑percent correspondence, information can still be gained from the mapping — even if only through deduction and exclusion criteria in the broader context.
If one follows the sales example, it would be consistent to place an empirical space in front of the decision space and to represent and integrate additional boundary conditions — at the very top, so to speak, corporate strategy. This would make visible the extent to which it influences decisions, whether product management is truly aligned with corporate strategy, and — contrary to common practice — whether a discrepancy might even put a realignment of the company up for discussion.
A brief look at Lilu — she seems to be attempting a kind of rope‑skipping in which her trunk grabs her tail and forms the rope (don’t ask) — tells me that it is time for another example and a move away from the abstract.
To remain, so to speak, in the pre‑decision space of product management — that is, according to which notions decisions about product design are made — we ask: what, for example, are the motives that speak for or against the introduction of features and ultimately products?
At this point, we skip the portfolio strategy of corporate leadership, which — in addition to profit increase and loss avoidance — may also aim at medium‑ to long‑term risk minimization through product diversification. We move into the area that links product design with communication strategy and falls into the discipline of Behavioral Economics.
The case in which a feature is no longer offered in a new product version generally occurs only when it is fully replaced by a new feature, when demand for the feature no longer exists, when its retention is technically impossible, or when it is economically untenable because it increases costs that potential customers are not willing to pay. Or, summarized: substitution, decline in demand, technical impossibility, or economic unviability.
These rational reasons must be presented by the product manager in a well‑founded manner. He may encounter decision patterns that are examined and described within Behavioral Economics:
- Loss aversion on the part of providers (removing a feature might anger customers).
- Status‑quo bias (one maintains a current state because one fears change).
- Sunk‑cost fallacy (lack of willingness to abandon something into which much has already been invested).
- Personal indulgence (giving something more weight due to personal preferences than it should have from an objective corporate perspective).
Before this now motivates one of you, product managers, to run to your corporate leadership and perform a haka — the traditional war dance of the Māori — because, after reading the above lines, you have concluded that convincing management with rational arguments is futile and intimidation attempts more promising, you should pause for a moment.
Behavioral economics does not aim to expose the irrationality of decision‑makers in leadership positions — or at least the authors in this field do not publicly communicate such an intention. It studies the behavior of homo oeconomicus, including that of ordinary customers — whether end customers or in the B2B sector.
Put differently, behavioral economics examines systematic deviations from rational behavior in the context of economic action. Admittedly, this sentence sounds like a logical error: what sense can studies make that examine deviations from rational behavior while expecting the results to be systematic? The answer is simple: rationality here is used as a term whose meaning is tied to the observer. Systematic means that there is a reproducible result depending on defined input conditions. In other words, there is a model capable of representing the expected outcome.
If such models exist, then — through additional intermediate steps — they could become part of the product manager’s pre‑decision space.
It is necessary to anticipate how a customer — more precisely, the customer base — makes decisions, since one wants to retain customers and gain new ones. This does not begin with sales, but earlier in the product cycle, with marketing and specifically with feature selection.
An example of such a mechanism — such a model — states that people evaluate comparatively rather than absolutely. In other words, they assess things in comparison, with the first impression setting the benchmark — meaning there is an additional bias in the evaluation. So‑called decoys can be used deliberately to lead a customer, when choosing between products, to select the higher‑priced one. The “trick” consists in offering, alongside the more expensive product, another product that is only slightly cheaper. It offers fewer features. Since the customer does not evaluate how much the extra feature costs the manufacturer, he is tempted to buy the higher‑priced product because, compared to the slightly cheaper one, he gets more value for his money. This comparison — and thus the feeling of gain — outweighs the question of what he actually needs compared to the cheapest product.
This effect, described vividly by Dan Ariely in Predictably Irrational, was empirically demonstrated primarily in a study by Joel Huber, John W. Payne, and Christopher Puto, titled “Adding Asymmetrically Dominated Alternatives: Violations of Regularity and the Similarity Hypothesis” from 1982.
The scientific details are of lesser importance here. Rather, it shows that there can be more reasons for omitting a feature — or for adding another product without this feature — than one might initially think, and that these reasons may appear fully rational at first glance.
When adding product features, one can proceed just as systematically as in the case of omission.
Reasons include:
- Regulatory constraints (consider the various assistance systems in new cars, which are not desired by customers but mandated by legislators).
- Comparison with competitors who offer these features.
- Differentiation from competitors.
- Customer demand.
- Technical or physical necessity due to the introduction of other features or changes.
All these arguments are rationally grounded. One must simply not forget the other side — the perspective of communication. It may appear less rational, but it follows models that can be used. The example above is only one of them.
From Market Signals to Transfer Functions
We have, at this point, for the first time introduced the customer — or more generally, the customer base — and, representing the market, integrated them as part of product‑management considerations. Starting from the role as the recipient of product design and market communication, we can now complete the diagram of product management and its relationship to the other actors.
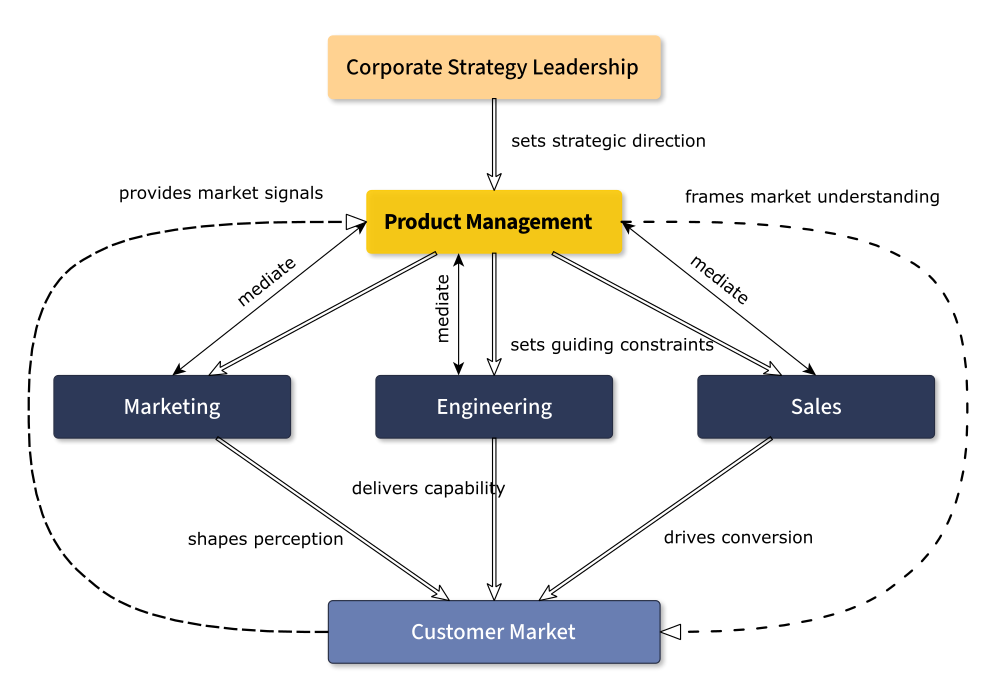
The notion of the market, or more generally the customer base and the individual customer — which has just been introduced de facto as part of a model — is reflected in the extended diagram in the rightmost connection: “frames market understanding”. Mirrored quasi‑diagonally, there is the connection that some product managers have probably been longing for — market analysis, the empirical component, expressed in the formulation “provides market signals”.
But analysis alone is not enough if one does not have a well‑founded notion — a model.
We are slowly approaching the finale. Let us briefly recap:
There is the corporate strategy and, following from it, a set of objectives. There are two steering dimensions in the form of product design and communication. Then there are various models that anticipate the market — or, here only exemplarily, customer decisions. In addition, we have market analysis.
To reach the finale, it is time to introduce a few new terms in order to make another level of meaning visible:
- Actual state (sales figures etc. before the change)
- Target state (the intended revenue, customer acquisition after implementing measures)
- Control variable (steering dimensions: portfolio changes, feature selection)
- Disturbance variable (changed customer demand, changed regulation, new competitor products: changed market conditions etc.)
If these terms mean nothing to someone, here is the resolution: they are terms from control theory. The parallels are not accidental. We have a state, a target value, possible influences, and external changes. Product management is, in principle, nothing other than a control‑engineering problem — albeit so far without its powerful toolbox.
In the extended diagram above, the following elements were implicitly introduced:
- shapes perception
- delivers capability
- drives conversion
Together with frames market perception, they form a component that fits control engineering. They all express the notion of how the market reacts to adjustments in product design and communication. More precisely, the first three express the actual effects of the market on these adjustments, whereas frames market perception expresses the expected reaction.
In control engineering, one speaks of the transfer function.
Model-Predictive Product Management
The distinction between the real transfer function and the expected — modeled — transfer function leads us to the concept of model‑predictive control. Whether in aerospace, the automotive sector, or wind energy — model‑predictive control is used everywhere today.
What they all have in common is that they operate with numerical spaces and typically with linearized models. In product management, and with the considerations described here, one would also be dealing with numerically quantifiable states in the form of revenues — but it does not end there. Feature selections have no inherent metric. They are assigned meaning. As we have seen, meaningful models are possible even without numerics. In addition, mappings can be realized between completely different spaces. Such coupling is possible and is the promising key to providing product management with a toolbox similar to that known from control engineering. This also applies to metamodels, which correspond to the chains of decision paths.
In the analogy between control engineering and product management, the functional organizational units — marketing, engineering, and sales — form the actuation, through which product management transforms impulses into effects. In engineering disciplines, however, one does not stop at merely controlling; one measures the effect of the control — the control variable — and corrects it when necessary. In model‑predictive control, one usually goes a decisive step further: one corrects the prediction, or more precisely, the conception of the prediction — the model of system dynamics in the form of the transfer function — when it does not correctly represent the effect.
No one would be advised to board a modern aircraft and take off if the engineers had limited themselves to the functioning of the control alone.
Why, then, should it be any different in product management? It shouldn’t be.
Anyone who practices product management without a correctable model‑based conception of impact — and without measuring that impact — is engaging in risky activism, not management. And when a product management function intervenes operationally, one must assume this is a sign of being overwhelmed.
Let us reconnect to the previous blog entry and extend the arc toward the tool landscape in Product Lifecycle Management. The following diagram is an approach to establishing precisely this connection and assigning the corresponding elements.
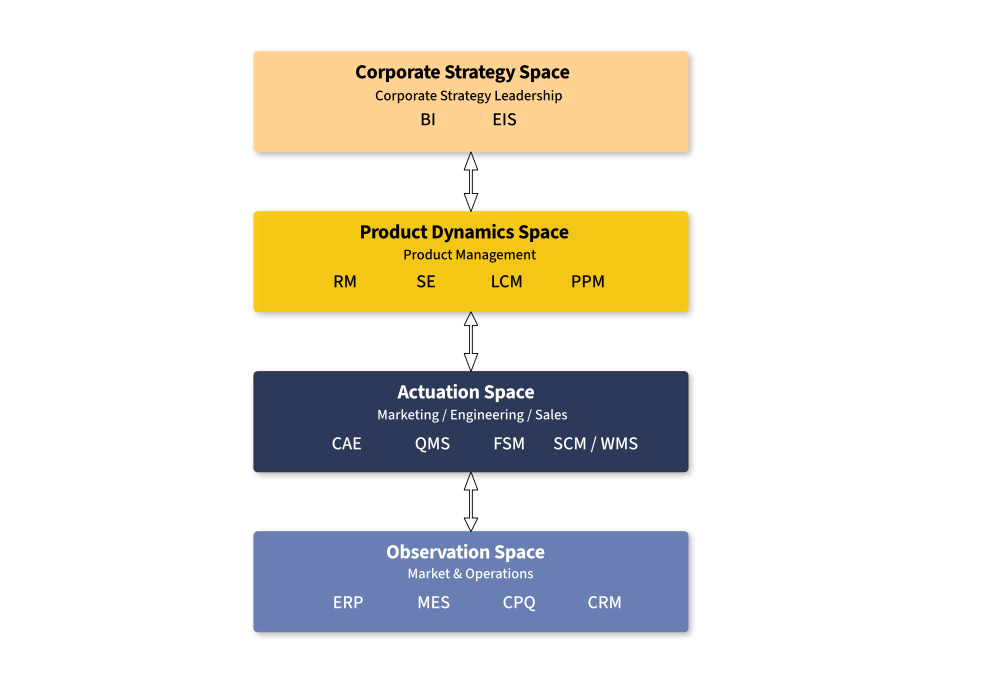
No claim to completeness or definitiveness is made for the diagram. In practice, tool vendors interpret the domains individually and without sharp boundaries. Complementing the software areas listed in the previous blog entry, the diagram is expanded by EIS, so‑called Executive Information Systems. One could most closely identify them as a management tool for the observation space — but only insofar as couplings exist. They nonetheless belong to the corporate strategy space, since they are a tool for executive leadership. The transition to product management could, from the perspective of the available tool solutions, be seen as fluid.
ERP, MES, CPQ, and CRM systems together form a central part of the measurement space for product management — regardless of who populates them.
Product management can certainly draw on various tools, but hardly on a product‑management software that fully supports the path outlined here. It generally cannot directly access the different data within the company but is dependent on requesting it from the departments. Instead of operating within a delimited area, an appropriate solution would have to operate across the entire space of all domains shown here — in the sense of comprehensive information processing.
A PLM system worthy of the name would have to provide product management with a toolbox comparable to that known from control engineering — and far beyond mere administration: information processing, modelling, process simulation and execution, and coupling of different decision spaces — AI‑supported, integrated, and free of silos.
Reflections on Practice and the Unpredictable
Let us return, in closing, to my little neighbor — and hopefully offer a conciliatory ending for all those who may have felt misunderstood or had their professional ethos bruised by the earlier remark about activism.
The still‑open question is whether my idea of the effect I could achieve with an introduction to astronomy for four‑year‑olds was correct, and whether his displeasure about his mother’s refusal to let him take an afternoon bath subsided. Let’s put it this way: for the moment of my explanation, it at least managed to distract him. His displeasure remained unchanged afterward. I cannot say with certainty whether my explanation of temporal sequences had any effect on him. Unlike me, he did not make a drawing or use analogies to tell me in a differentiated way whether he did not understand or he understood it but simply did not care. Naturally, for the sake of my ego, I want to believe the latter. His mother did not care much about the cause and is well aware of his persuasive abilities. In short: the bath took place in the afternoon.
Of course, afterward I wanted to know more precisely, so I planned to show him the different position of the sun at another time of day the next morning — and, while at it, to build a sundial with him.
It happened as it had to: there was no trace of bright sunshine or a cloudless sky. It was so overcast that one probably could not have identified the position of the sun even with a smartphone and brightness measurement. Conclusion: verifying and correcting models — and conducting measurements — can be difficult in practice.
I suggested to his mother that next time I could give him an introduction to quantum theory for four‑year‑olds, since that would work even in bad weather. Lilu smacked her trunk against her head at my suggestion, then shook her head wildly from side to side, and finally fixed her gaze rigidly toward the sky without lifting her head. If an ethologist reads these lines and can interpret her signs, they should please get in touch. Despite historical novels, Hannibal does not appear in Umberto Eco’s works, and otherwise I am not aware that he ever wrote a word about the signs of elephants. As I said, she does not make it easy for me.
Unless another topic suggests itself beforehand, concrete implementations will follow — building on the first three posts, not in a single entry but distributed across several, each based on clear examples.
Stay tuned 😊!
After the previous post discussed the advantages of Excel and the lessons one should draw from it, the analysis continues here. No worries — not Excel again. The blog shouldn’t lose its credibility right at the beginning, and Microsoft wouldn’t pay for that anyway. The focus lies on MBSE in companies and how it is represented in existing enterprise software, or rather how well it is conceptually integrated.
Since examples are well suited to analyse and illustrate matters, this blog entry begins with such examples — though with ones that at first glance seem to have little to do with the topic:
- Germany’s elimination at the 2026 Football World Cup against Paraguay in the round of the last 32 teams
- Stuttgart 21: a German railway project that was supposed to open in 2021 and is now not expected to be completed before 2031. Cost increase from €2.5bn to over €11bn
- Berlin Brandenburg Airport. Planned opening 2011. Actual opening 2020. Cost increase from €2.5bn to over €7bn
- Mars Climate Orbiter (1999). Loss of the probe due to differing units
- Space Shuttle Challenger (1986). O-ring failure leading to the explosion of the shuttle with 7 fatalities
- Fall of Constantinople (1453) and the end of the Byzantine Empire
- Sydney Opera House (1959–1973) with a ten-year delay and a fourteenfold cost explosion
- Near-extinction of the Kakapo in New Zealand. Current population approx. 250 animals
Now the decisive question: What do all these examples have in common? As in well-known assessment centre tests, the answer is: “It depends on whether…”
Exactly like the question: Which element does not fit in the following list?
Apple, banana, pear, peach, watermelon, toilet bowl?
Obviously the answer is peach — the only element with a fuzzy rather than smooth texture. And just like in such tests, only one — a different — answer is expected above. So why deviate from this familiar pattern? Let’s keep it.
In fact, there is more than one commonality. The most obvious is failure or breakdown in the sense of an unintended outcome. Sure, in Paraguay the victory over Germany was declared a national holiday… and there are voices in England that demanded the same for the British Isles after Germany’s early exit. And the Ottomans in the 15th century would hardly have spoken of failure. These “special” perspectives are not the topic here. The correct answer is: toilet bowl.
The second commonality is a truism: hindsight is always wiser. But there is an extended observation that seems to appear after every failure: people who claim they always knew it, who foresaw the catastrophe early on. During the World Cup, everyone mutates into an expert.
A short digression must follow: Argentina and all football fans may forgive this — losing a World Cup match and being eliminated is not a catastrophe like the loss of human life, even if media coverage suggests otherwise.
Life is not fair: those who succeed have many “friends” and nothing to explain. Those who fail must justify themselves. Combined with human behaviour and self-enhancement, it becomes difficult to distinguish between substantial voices and those that fall merely into the category of self-promotion.
Of course, after catastrophes investigations take place. But in smaller or medium failures this is often not the case. Responsibilities shift and self-interest dominates.
This brings us to the third commonality — or the question of whether such a commonality exists. If, after failure, there are voices that not only claim they knew things beforehand, but are substantial voices that had spoken up earlier, why did failure occur anyway?
Let us therefore turn to the “peculiar” bird from the title — the Kakapo.
Anyone who has spent time in New Zealand knows that from the outside there seems to be more than one peculiar creature there. And this is not about the human inhabitants. They undoubtedly possess a healthy dose of self‑irony, which makes them very likeable:
How else can one explain that they use the Kiwi — a flightless bird — as an emblem on their military aircraft? (You simply have to love the country and the Kiwis, as they call themselves.)
Douglas Adams describes the peculiarities of the Kakapo in his book Last Chance to See (1990) in an unmistakable way. I will only summarise here and otherwise recommend his book.
The Kakapo is, at up to 4 kg, the heaviest parrot in the world. It feeds on plants, is nocturnal, and with a lifespan of 90 years extremely long-lived. Since it is unfortunately also flightless and exhibits further curious traits, it would hardly reach such an age today without protection and in the wild.
Because New Zealand historically had no mammalian predators, the Kakapo freezes when threatened and relies on camouflage. This works with aerial predators. With dogs and cats — known for excellent sense of smell — only as well as a small child who covers its eyes and believes it cannot be seen. With the difference that children are generally not eaten — the Kakapo, however, is.
Matching the hide‑instead‑of‑flight concept, it also emits no warning calls when threatened. This would contradict the principle of hiding and would be pointless, as it is a solitary animal. But pure solitary animals cannot form a species, so mating occurs regularly. Regularly for Kakapo females means only every 2–4 years, when there is an abundance of Rimu fruit. The more active role falls to the females. They must first find the males. As mentioned: solitary.
The males do make an effort: they build bowls — depressions — and emit low‑frequency mating calls (“booming”) to attract females.
This has two drawbacks.
- Low‑frequency sound travels far but is harder to localise. Anyone with a subwoofer knows the phenomenon.
- The more difficult localisation succeeds more easily or quickly for predators than for the intended females, so when the latter do manage to find the origin of the call, they often find only the bowl and some feathers. The rest of the suitor is in the digestive tract of a predator.
In summary, the Kakapo has a massive communication problem — amplified by the lack of adaptation to changed conditions.
Insufficient, poor or missing communication is exactly one — or the decisive — reason for failure in the examples listed above. It forms the central third commonality.
We now change the scene: away from the peculiar bird and towards Lifecycle Management and MBSE — but without losing sight of the Kakapo’s communication problem.
Lifecycle Management
We begin with an overview of Lifecycle Management and what it denotes or means in the context of product manufacturers.
The term “Lifecycle Management” suggests using a circle for illustration:
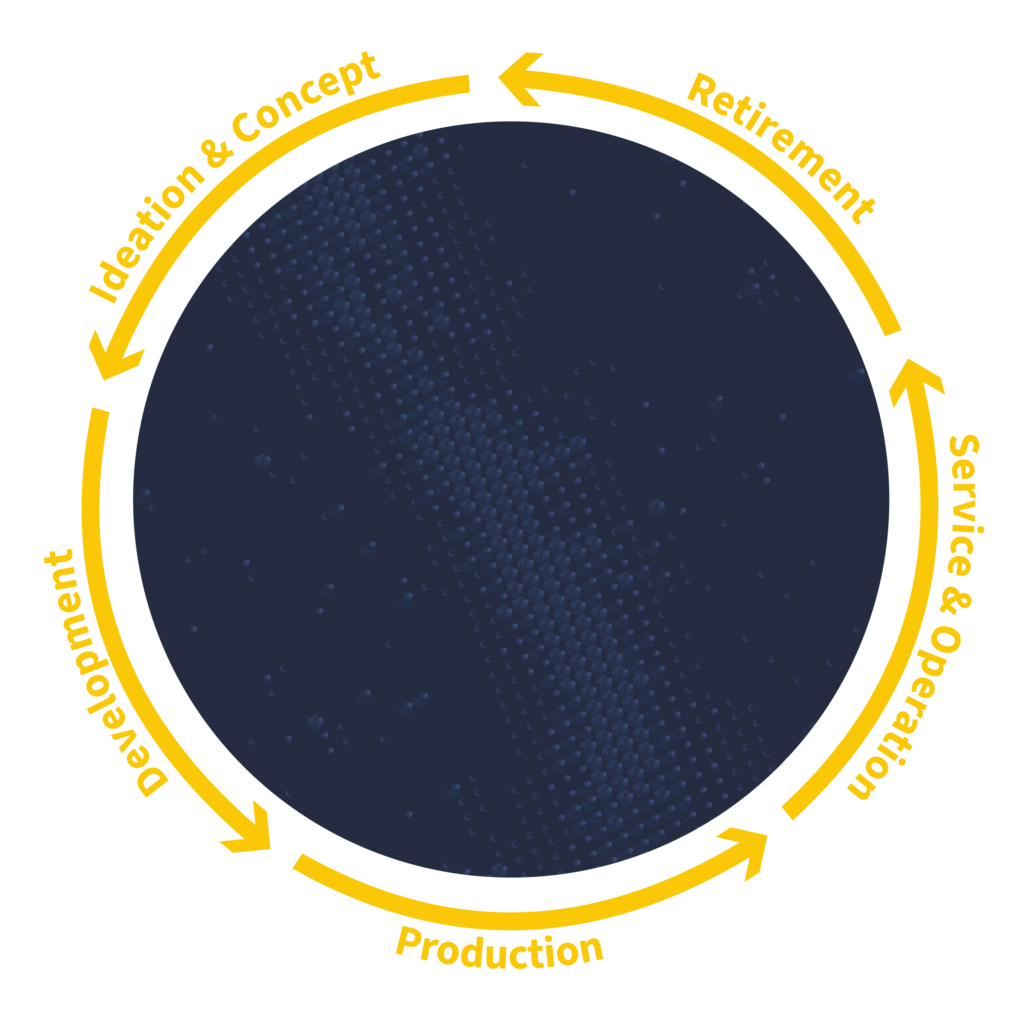
The lifecycle of a product can be roughly divided into five phases:
- Ideation & Concept
- Development
- Production
- Service & Operation
- Retirement
Neither the division nor the names are fixed. Finer subdivisions and deviations are common.
The structure simply follows the temporal sequence a product undergoes: from the first idea, through concept, development, manufacturing and distribution, to disposal or recycling.
At this coarse level, there is no complexity. It would be a simple linear process. If one wanted to integrate the V‑model commonly used in engineering, one would simply straighten its legs and insert it into the circle in place of the development phase.
But the V is chosen for a reason. It itself represents cycles. The above cycle representation is not wrong, but incomplete regarding complexity.
An extended illustration is shown in the following figure:
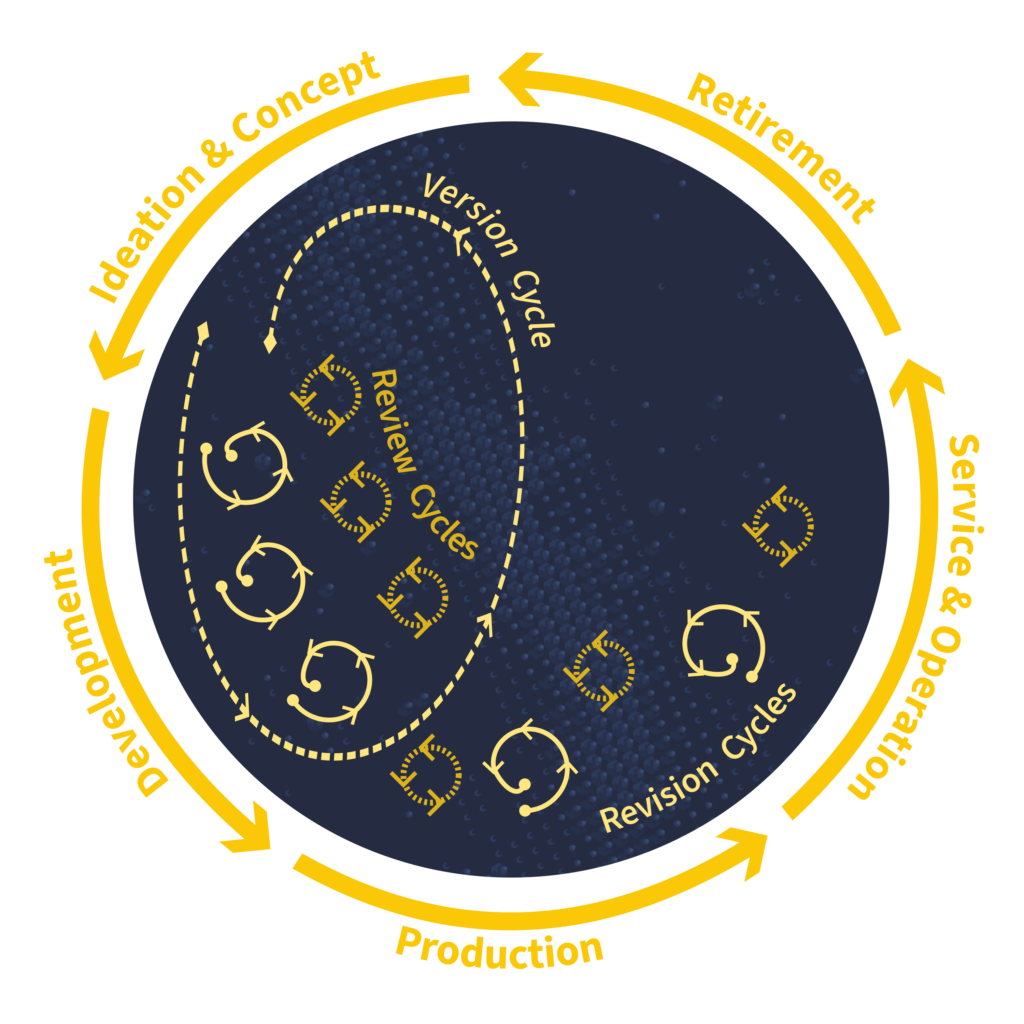
The earlier blog post pointed out the usual distinction between projects and systems as associated with products. Curiously, the term “lifecycle” would be more fitting for large projects than for product development. It suggests that only after the end of a product’s life a new generation begins. This may be true for highly individualised craft products, but not for industrially manufactured ones. Especially in software, cycles are much shorter and do not run through the entire product lifecycle. Once the first concept is completed, work begins on a new or revised concept while other phases still work on the previous one. If speeds were identical, processes would only be phase‑shifted. Due to unavoidable differences in effort and duration, multiple assets exist in parallel. Products consist of components with their own revision cycles. Complexity increases enormously. Not one asset, but several parallel ones must be managed.
Before revisions, reviews often take place. Depending on industry, company size and product complexity, these vary in scope and involve more than one department and more than one specialist.
In addition to these cycles, another factor arises: not only versions and revisions are processed in phases and in parallel, but also variants — from fixed product families to highly individualised customer‑specific products.
This aspect is illustrated in the following figure.
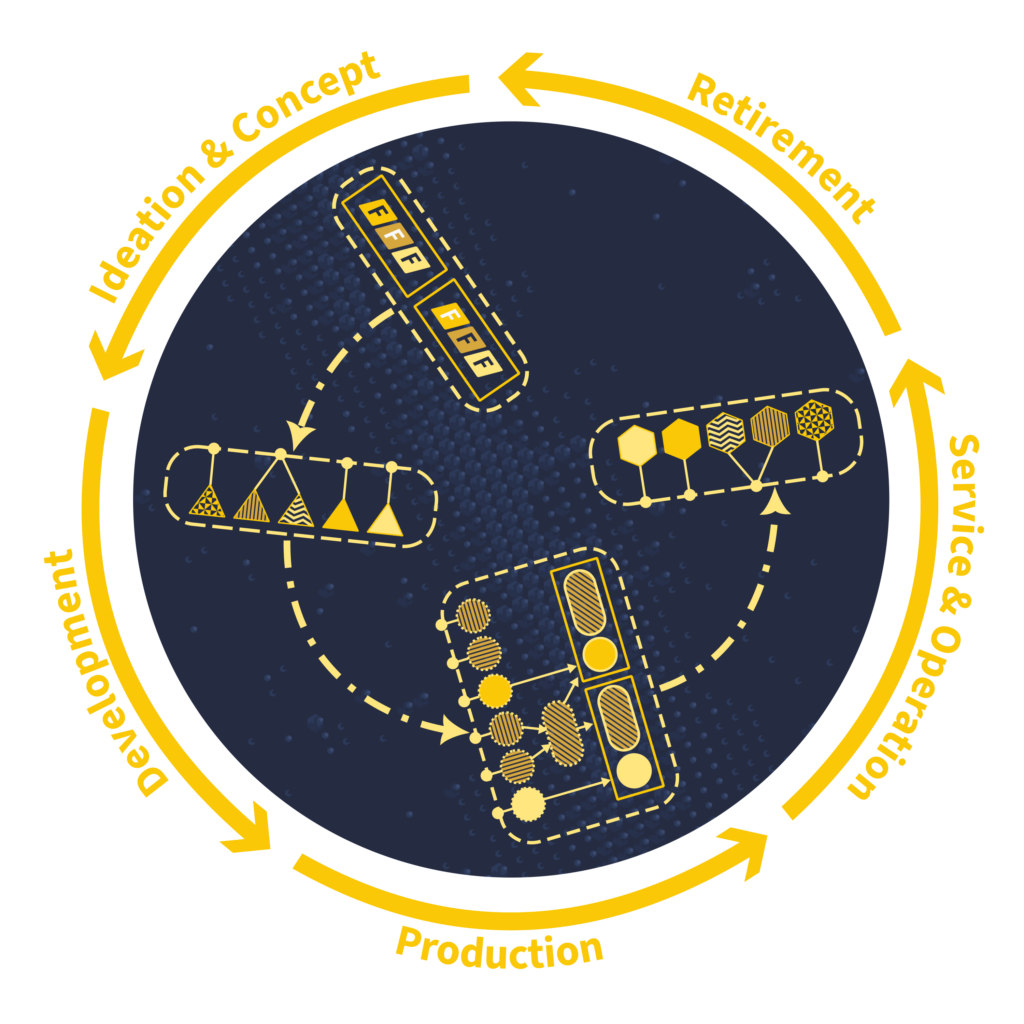
For product families, the lifecycle begins like for a single product in the ideation and concept phase. Here markets are targeted and features per customer segment and regulatory region are defined. They can be divided into two groups: those shared by all products in a family and those possessed only by a subset.
Further differentiation may occur in development if the concept‑phase differentiation is insufficient. Ideally it follows the variant strategy of the concept phase. Development is also the phase where solutions can be tested and discarded and customer‑specific adjustments made. Depending on perspective, requirements specifications are created at the end of concept or beginning of development. Manufacturers do not develop alone but use suppliers. The concrete specification is part of the supplier’s specification. Over time, further variants arise. Additional differentiation follows from different test sites. Different test environments require specific procedures and parameters — both in development and production quality assurance.
Further differentiation follows the same pattern in service and operation — think of service protocols or user manuals.
Another differentiation, essentially part of development, follows a different objective: modularisation. It aims to offer many end variants with as few identical components or subsystems as possible. Modules are formed, achieving consolidation. Module decomposition can cut across functional features — only multiple modules together achieve a functional feature.
The retirement phase is not discussed further here. It is becoming increasingly important due to sustainability laws. The mechanisms are similar.
Organisational Structure and Information Flows
A functional division into organisational units looks like this:
- Product Management
- Sales
- Engineering
- Quality Management
- Procurement
- Manufacturing
- Logistics
- Service & Operation
External actors:
- Regulators
- Suppliers
- Customers
As with the subdivision of the phases, this structure and these labels do not represent a specific company structure, but functional groups. Additional ones are subsumed here for the sake of simplicity.
The interesting part emerges only when placing them in a matrix together with the phases:
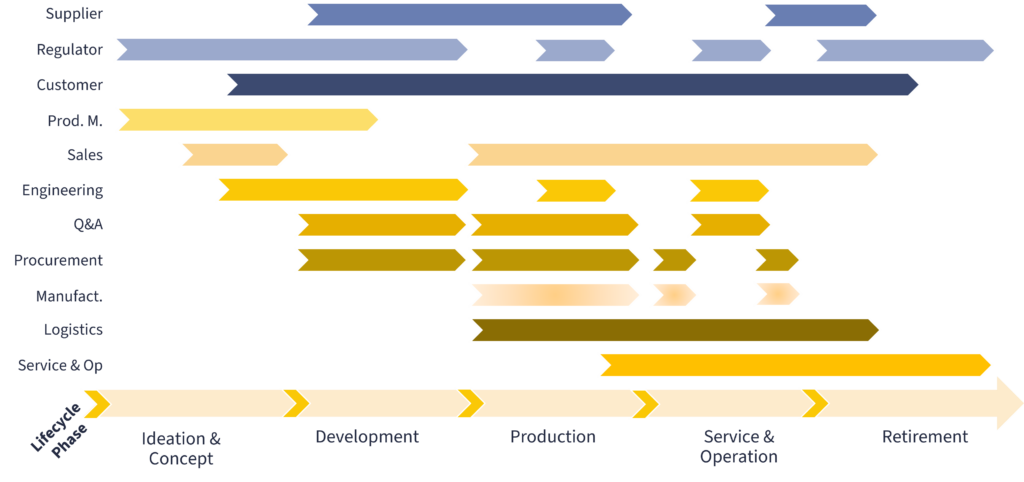
In this representation, it is illustrated in which phase each actor is active. As a reminder: this refers to the phases, not to real time. Otherwise, one might consider outsourcing product management for cost‑saving reasons, since it appears to be underutilized. A translation into real time would reveal differing levels of effort as well as parallel work. Depending on the chosen subdivision, slightly different activity matrices are also conceivable. Hence the repeated note: in a company, the assignment of departments to functional organizational units may differ from what is assumed here.
This form of representation enables something else: it marks the space of all conceivable information flows. That is, it allows potential communication points to be delimited. The sequence of phases corresponds to the processing direction. This describes the horizontal dimension. Vertically, information flows arise between actors or organizational units that are involved in the same phase at the same time. This is where results are aligned, supplemented, or refined. This is where the review cycles take place.
Diagonally, information flows arise between actors that are involved in adjacent phases.
Information flow means nothing other than passing on a result — in short: communication. Since I don’t know whether italics alone are sufficient and Lilu already threatened to leave Configena if I attend a training course in operant conditioning, here’s the hint: Kakapo!
MBSE in Context
Let us now turn to the topic of MBSE and its classification. As a reminder, here is the definition as used by INCOSE:
“MBSE is the formalized application of modeling to support system requirements, design, analysis, verification and validation activities beginning in the conceptual design phase and continuing throughout development and later life cycle phases.”
If one compares this definition with the lifecycle landscape outlined above, one would locate the main focus of MBSE in the development phase. However, it also states quite clearly that the application of MBSE is not limited to this, but instead covers the entire cycle, from the first to the last phase. That MBSE is more than SysML, diagrams, and system architecture was already emphasized last time. This raises the question of what other software exists in companies in the area of Lifecycle Management?
The short answer: a great deal.
Here comes a list:
- ALM
- BI / Business Analytics
- BPM
- CAD/CAE
- CLM
- CMMS
- CPQ
- CRM
- EAM
- ERP
- FSM
- IoT Monitoring
- MES
- QMS
- RM
- SCM
- SE
- WMS
Apart from the fact that very few people are likely to know all of these abbreviations, many of them would hardly be associated with Lifecycle Management — and even less so with MBSE. A description of all of them is omitted here, as is any claim to completeness of the list. Instead, the following presents an attempt to classify these tool categories within the lifecycle‑activity matrix shown above, and then to examine one example in more detail.
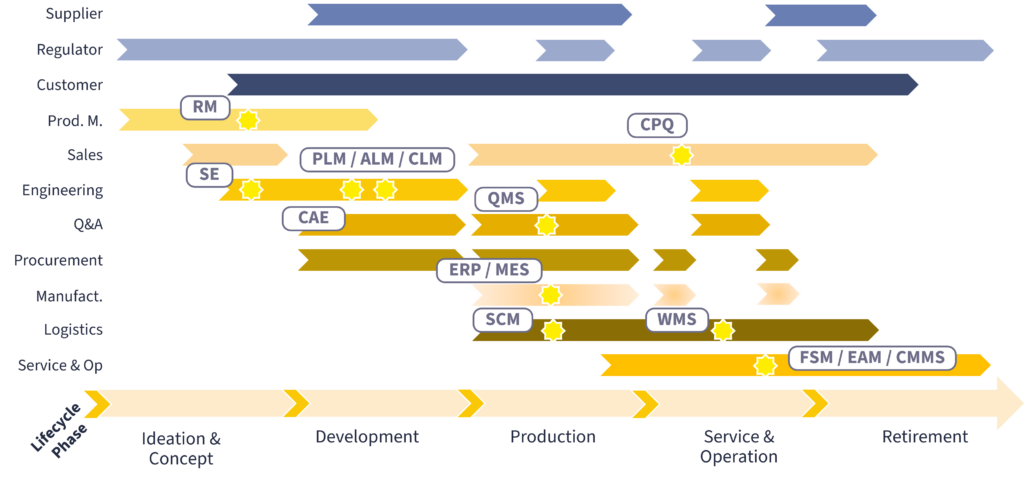
The stars in the figure mark the focal area in which the respective tool category is situated. The organizational and phase domains each extend beyond this focal point. SE and RM here stand for Systems Engineering and Requirements Management — meaning that SE represents precisely those tools one would most readily associate with MBSE. Contrary to the placement just mentioned earlier, both of them appear here in the ideation and concept phase.
These terms are not protected designations but categories originating from for example research work and shaped by individual authors. Companies assign their solutions independently — and driven by marketing — to one segment or another. This leads to the situation that individual solutions from vendors may cover very different areas. Company and product acquisitions in recent years have resulted in more areas being addressed, although the respective focal points may differ. The impression one gains is that integration is hardly addressed adequately. In some cases, identical or at least overlapping areas within a vendor’s portfolio are covered by different product solutions; in other cases, gaps emerge. Beyond strategic considerations, the expansion of product portfolios reflects the realization that the complexity outlined above — and the resulting needs of customers — must be addressed comprehensively. In addition to acquisitions, alliances and partnerships play a role. Little new legacy is created; instead, existing legacy is expanded. This makes true integration more difficult.
Two competing customer wishes stand in opposition here: on the one hand, the desire for maximum integration — the all‑from‑one‑hand solutions that large vendors are most likely to promise — and on the other hand, vendor independence and diversification. There is therefore a perhaps not entirely new but more recent domain addressed by small to medium‑sized companies and startups. They are not true connecting elements. Put simply, they do not operate within the existing data but on top of it. That is, they take the existing data and integrate it into their own perspective — nowadays often marketed with AI approaches. Another frequently used term in this context is Single Source of Truth. This works until they are acquired. Then they become a component in the so‑called Digital Thread. And the legacy grows.
A provocative question: How is a Digital Thread supposed to be realized under such conditions?
ALM (Application Lifecycle Management), PLM (Product Lifecycle Management), and CLM (Configuration Lifecycle Management) already carry the term ‘lifecycle’ in their names. Semantically, they all address the holistic, cross‑phase approach most strongly.
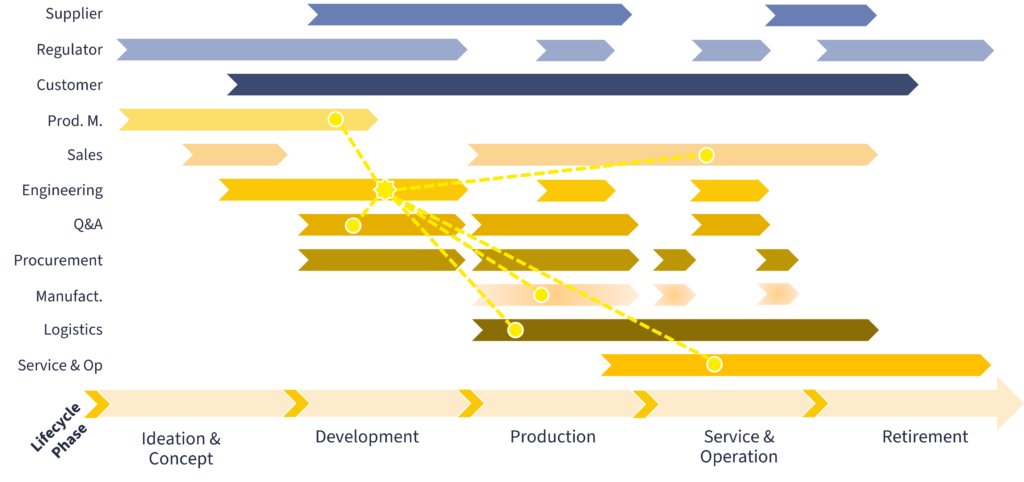
As an example, let us now consider PLM. The term ‘Product Lifecycle Management’ suggests a continuous coverage of all phases of the lifecycle. In practice, however, it becomes evident that PLM does indeed address central areas, but by no means covers the entire space of information flows. The following figure represents an attempt to capture what PLM actually encompasses. As a reminder, this does not imply that specific software solutions cannot deviate from it.
In direct comparison, the following shows the same figure for ERP (Enterprise Resource Planning).
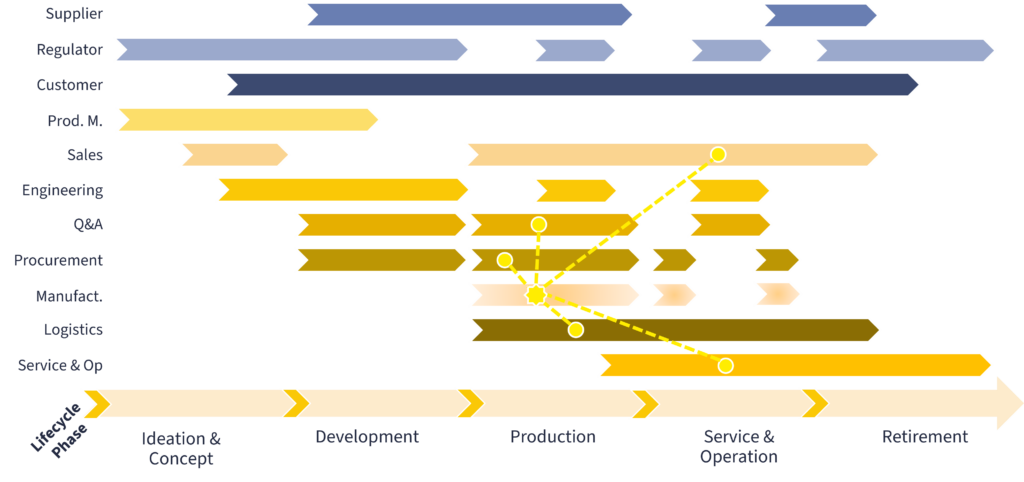
The form of representation with connecting lines from the focal point to the additional points of linkage is freely chosen. It highlights the area of coverage, but does not depict the information flows — or, more precisely, the communication paths.
Three points stand out:
- A real digital thread is not a linear thread but a net of interconnected thread pieces.
- The examples of PLM and ERP clearly show overlapping or adjacent areas. In a holistic view, these represent the boundaries or barriers that must be overcome in communication. They are typical points at which Excel or CSV file imports and exports occur.
- Conceptually almost identical solutions exist in different domains. Examples include state machines and activity diagrams in engineering, compared with BPM models and business processes in the commercial environment. Although they represent similar mechanisms, they are used in different domains, given different names, and developed separately. As a result, parallel but independent descriptions of the same subject matter emerge.
All three points are essentially matters of communication.
Before diving deeper, a fundamental question arises beforehand:
Why should one even want to strive for a continuous information structure? For what purpose should the realization of a Digital Thread be made a goal — or even elevated to a strategic instrument?
The answer is simple: Ultimately, it is about enabling well‑founded, transparent, and at the same time faster decisions.
Take as an example the image sketched above, illustrating the complexity of the product lifecycle shaped by variants, modularization, and product and component versions that must be maintained in parallel:
A single component can exist in multiple variants and versions. It is part of one or more modules that are installed in several products with multi‑year operating lifetimes for which spare parts must be kept available. For manufacturing, subcomponents are required that can be sourced from different external suppliers. There are various production sites for the component with differing manufacturing times. There are inventory stocks of the component, it can be assigned prices, and modules containing this component can be offered as product options in sales. Additionally, applications run on the module and component or integrate it.
Thus, the component is not merely an engineering asset but becomes the subject of decisions ranging from product management to sales strategy. A kind of emergence arises that goes beyond — for example — dimensional measurements.
It is this perspective shaped by multiple viewpoints that enables an asset item to be represented within a larger model space with multiple layers of information, and that constitutes the value of MBSE.
This requires a shared information space in which, so to speak, a common language is spoken — one in which each party is responsible for its own domain, yet communication between them can take place without major obstacles.
What was observed above describes the opposite: fragmentation, obstacles, multiple languages requiring constant translation.
A Peculiar Bird Returns
It is time to return to the Kakapo and its “own” communication problems — to see what can be learned.
Anyone who has been out and about in European major cities in recent years could observe a behavior there — especially on mild summer nights — that is strikingly reminiscent of the Kakapo.
The reference is to male individuals who — in their demeanor reminiscent of teenagers, though their appearance suggests they must be older while still not having reached middle age — drive powerful vehicles around city centers. From the perspective of this group, the louder and more low‑frequency the noise emitted by the vehicle, the better. Whether the courtship sounds produced by the vehicles achieve the presumed intended effect on the fairer sex has not yet been scientifically demonstrated. Doubts are warranted. What is, however, confirmed is that it attracts the police — comparable to the predators in the case of the Kakapo male. Here, too, a communication problem exists.
Despite these similarities, there is a decisive difference that helps to understand communication. Following Douglas Adams’s example, a context was established that makes the Kakapo’s courtship behavior — and the production of low‑frequency sounds within it — appear completely absurd.
What sense does it make to produce signals that cannot, or can only barely, be located? Quite simple: the actual purpose of emitting the signal was never localization!
The described group of male individuals does not perform its courtship behavior with their vehicles on remote fields in rural areas, expecting that the female sex will be attracted from afar by the sound. They do it where an appropriate audience can be expected! The city is the tacitly agreed‑upon mating ground.
The Kakapo population before the arrival of cats and dogs in New Zealand is estimated at up to around 100,000 individuals. The population density was correspondingly high, so that random encounters worked better. In that moment, the task was to convince — not merely to draw attention.
How Communication Works
- It requires senders and receivers who can switch roles during communication. Put differently, it requires the right addressee.
- It requires functioning signal transmission.
- It requires a shared protocol allowing shared interpretation and possibly decryption.
- It requires a filter allowing the receiver to separate the intended message from simultaneous information.
If one of these is missing, communication fails.
What goes wrong in the Kakapo’s communication? What would the Kakapo need to change?
The answer, as so often, is ‘It depends on whether…’.
One would spontaneously tend toward ‘Lack of functioning signal transmission’. Assumption: the mating call says, ‘Come here, I am here!’ Then the information of ‘here’ is missing, simply not transmitted appropriately. Correct? Only if one interprets the mating call that way. Otherwise, rather not. No one would come up with the idea of saying that two people had communicated when a phone call was missed.
Communication begins only when the Kakapo female sees the male and hears or feels his call. The communication is more complex; it is audio‑visual, it is multimodal, and it includes the male sitting in the bowl and producing sounds. Together, this says ‘Take me!’ — not the mating call alone.
A communication problem that exists for the Kakapo is that the mating call is indeed part of perfect communication — unfortunately with the wrong addressee. Here, the problem is the appropriate communication protocol. When the Kakapo sends out ‘Toujour amour!’, the cat hears: ‘There is something juicy to eat. You just have to find me. Come! I am delicious!’
Incidentally, in scientific circles the thesis is also put forward that the mating behavior of the described group of male individuals represents a double communication problem of the third kind: sexually receptive female individuals are said to feel rather repelled by it. Just a side hypothesis.
Hypothetical Solutions
What would the Kakapo hypothetically need to change?
Since this concerns a hypothetical solution, one can consider various approaches:
- The Kakapos take their cue from the group of male car enthusiasts and relocate their courtship behavior to a tacitly agreed‑upon place. Searching and finding are shortened, and thus the courtship itself as well. The problem: just as the police do not look for their ‘candidates’ in remote fields, mating sites will soon become known to predators.
- The Kakapos supplement their ‘call’ with a location indication — say, by modulating the call or in the style of Morse code. The female can find the male more quickly.
Both solutions address part of the problem. These approaches correspond, in a figurative sense, to what happens today in the software landscape — how tool and information integration is carried out. The information space is additionally expanded.
However, in the approaches mentioned, one essential point has not been addressed at all: if the message ‘Take me’ continues to be communicated through a clearly visible bowl, the male visibly sitting in it, and booming, the risk of being found by predators remains high. This audio‑visual structure follows an evolutionary, unwritten rule.
The fragmented tool landscape follows the same pattern. That is why parallel solutions for essentially identical questions persist.
Semantics, Structure, Rules
The hypothetical solution for the Kakapo male would be to focus on the semantics — that is, the meaning and core of the message — and convey it differently. To establish a structure and new implicit rules as a protocol for the female.
Here, as said, hypothetical, since evolution is not a process adjustment within a single generation. For the group of sports‑car enthusiasts, it would likely be difficult to persuade them instead to — say — write poetry. But with regard to MBSE according to the INCOSE definition, there is hope.
This is both conclusion and bold thesis.
The distinction between semantics, structure and rules may be key. One final remark:
When people with different languages come together, they still learn to communicate over time. Creole languages are exactly the result.
They follow the principle: rules follow structure, structure follows semantics.
Why then do today’s IT tools still follow the opposite paradigm — and why is it not broken even with AI?
So far up to this point. More — and also examples — in subsequent posts.
Stay tuned!
Asking whether MBSE can be done in Excel will strike a seasoned systems engineer or system architect as a personal insult — almost an attack on their professional integrity, if not outright blasphemy.
It’s a bit like suggesting to a die‑hard motorsport fan — someone who lives for the deafening roar of a V8 — that they should consider buying an electric car. The reaction is predictable: a moment of stunned silence, followed by serious doubts about the other person’s mental stability.
Fortunately, such reactions are usually spontaneous and short‑lived. After all, the role of a systems engineer is fundamentally incompatible with religious attitudes toward tools or methods.
To ground the discussion, let’s take one of the shorter definitions of Systems Engineering from the SEBoK — and treat MBSE simply as a tool‑supported approach within it:
“Systems Engineering enables the realization of successful systems that meet the needs of customers, users, and stakeholders.”
For completeness, here is the NASA definition:
“Systems Engineering is a methodical, multidisciplinary approach for the design, realization, technical management, operations, and retirement of a system, with the goal of meeting requirements within cost, schedule, and other constraints.”
In short: Systems Engineering is about finding an optimal solution — optimal in the eyes of the stakeholders — under given constraints.
And “optimal” is always subjective. Evaluation is always contextual.
A family vacation, viewed as a “system,” fits this definition just as well as the architecture of an advanced driver‑assistance system.
Anyone hoping to find advice here on how to plan a stress‑free family vacation using Excel should — for the sake of the children — consider separating from their family instead. The children, much like the motorsport enthusiast above, would begin questioning the parent’s sanity long before puberty.
And for those thinking, “Well, Excel isn’t MBSE‑capable anyway! For family vacations you obviously use Cameo / MagicDraw!” — please leave your contact details. I will forward them to the appropriate child‑protection authorities.
Using Cameo, Enterprise Architect, Capella, Rhapsody, or similar tools for family vacation planning would be absurd.
But let’s flip the question:
Who has ever heard of these tools being used to design a building complex, a garden, an airport, a new train station, or in crisis management?
Most likely: no one.
Of course, specialized tools are used in all these domains — but none of them are MBSE tools, even though every one of these examples fits the definition of Systems Engineering perfectly.
Take a well‑known German infrastructure project: Stuttgart 21.
Originally planned to open in 2021, the current estimate is 2031.
The reasons for the delays are — to put it mildly — an underestimation of complexity, such as recently revealed in the digitalization of the rail hub.
In other words: requirements and dependencies were not adequately represented.
And that is exactly where MBSE aims to help: by modeling requirements and solutions, enabling structure, consistency, and transparency.
Yet none of the MBSE tools mentioned earlier are used in such projects.
So the question is: Why?
What we can say with certainty is that Excel appears in all of these domains — no matter how different they are.
So the question becomes: Why Excel?
If organizations spend enormous amounts of money on software, their choices should reveal the benefits they expect.
But these benefits seem to align far less with the textbook definition of Systems Engineering — and far more with practical realities.
To understand this, we need to look at how and where the listed tools are actually used.
A kind of reverse‑engineering approach leads us to the answer.
There is a fundamental difference between the examples above and the domains where MBSE tools are predominantly used today — automotive, aerospace, and similar industries.
The difference is visible even in language:
No one calls the earlier examples “systems.”
They are called projects. Implementation projects.
All of them are one‑off endeavors with:
- unique constraints
- unique stakeholders
- unique artifacts
- little reuse
- little formal specification alignment
- high situational dynamics
MBSE tools, on the other hand, were historically built for product‑oriented, repeatable, variant‑rich development processes.
With the exception of Capella, most leading tools rely on SysML — itself an evolution of UML, originally created for software development. SysML v2 does not change this heritage.
The SysML v2 specification currently spans roughly 1,300–1,500 pages, depending on what you count.
Even the core language specification alone is around 350–400 pages.
A one‑off project driven by communication among diverse stakeholders would run straight into a highly complex language that must first be learned.
Two more points matter:
- None of the vendors call their tools “MBSE tools.” They correctly call them Systems Engineering tools or system architecture tools. Yet many people equate MBSE with SysML diagrams — incorrectly.
- In industry, SE tools are almost never used alone. They are combined with requirements management systems, test management systems, and configuration management systems. When people associate MBSE with diagrams, the diagramming tools are perceived as the “MBSE component.”
Both assumptions are wrong.
For comparison, here is the INCOSE definition of MBSE:
“MBSE is the formalized application of modeling to support system requirements, design, analysis, verification and validation activities beginning in the conceptual design phase and continuing throughout development and later life cycle phases.”
It does not mention diagrams.
It does not reduce MBSE to architecture modeling.
The moment artifacts across systems — from requirements to testing — are connected, you are operating within the MBSE scope.
Now imagine applying such a toolchain to the earlier project examples — say, airport construction or landscape design.
It would be completely unsuitable.
And yet, the INCOSE definition highlights something these projects do need:
formalized structure, traceability, and consistency.
But instead of a tool, they rely on specialized project developers who use a variety of domain‑specific tools — none of which are Cameo or similar.
Processes that must meet formal requirements are not captured in models or metamodels, but in the experience of the people involved and in past reports.
So the question of whether MBSE can be realized in Excel is not about replacing the automotive toolchain or suggesting that SysML v2 should be abandoned.
It is about the core idea expressed in the INCOSE definition.
And the question of why Excel is used across so many domains has nothing to do with “needing a spreadsheet,” just as one does not use a fork only for one specific dish.
Excel provides something far more fundamental.
Excel is a generic modeling, structuring, and communication tool — even if most people don’t consciously perceive it that way.
And before this turns into a hymn of praise for Excel:
It won’t.
This is an analysis — a reverse‑engineering exercise to understand why Excel works everywhere, and what that implies for alternative MBSE approaches.
1. Excel is ubiquitous — and instantly accessible
Excel has a level of familiarity no other tool can match. It is:
- present in every industry
- installed on every computer
- understood by every stakeholder
- usable without training
Excel creates no entry barrier.
It requires no explanation, no rollout, no cultural acceptance — it already has all of that.
In multi‑stakeholder projects, this is invaluable.
2. Excel turns everyone into a UI designer
Excel is the only tool that lets anyone create their own interface without ever hearing the word “UX.”
People can:
- build input forms
- structure tables
- define layouts
- highlight information
- use dropdowns, filters, and buttons
Excel is a visual tool that people use intuitively.
It forces no predefined perspective — it lets everyone build their own.
3. Excel unifies analysis and data flow
Excel is simultaneously:
- a data model
- a data‑flow model
- a calculation engine
- an analysis tool
- a visualization platform
Every cell is a node.
Every formula is a data flow.
Every table is a model.
Excel is — without being labeled as such —
a lightweight universal modeling tool that merges structure and analysis in one medium.
4. Excel is a freely definable metamodel container
Where specialized tools impose a fixed metamodel, Excel does the opposite:
- no predefined artifacts
- no mandatory relationships
- no fixed views
- no modeling language
- no tool dogma
Excel adapts to the project —
not the other way around.
That is why Excel works in one‑off projects,
and SysML tools do not.
5. Excel connects stakeholders who otherwise could not work together
Projects bring together people who:
- speak different professional languages
- use different tools
- think in different models
- have different responsibilities
Excel is the one tool everyone understands.
It is a universal communication medium —
not because it handles tables,
but because it requires no translation.
6. Excel is fast — and speed beats perfection
Projects depend on:
- rapid iterations
- rapid decisions
- rapid adjustments
- rapid prototypes
Excel is:
- instantly available
- instantly adaptable
- instantly extendable
- instantly shareable
No other tool is this fast.
And in projects, speed often matters more than perfection.
7. Excel is an integration hub
Excel can:
- import
- export
- link
- automate
- script
- use APIs
- pull data from other tools
Excel is the glue between all other tools.
It connects what would otherwise remain disconnected.
In short
Excel is not everywhere because people love spreadsheets.
Excel is everywhere because it is:
- universally understandable
- universally adaptable
- universally integrable
- universally available
Excel is the tool that adapts to any project —
no matter how complex, chaotic, or unique.
And that is why it appears in all the project contexts mentioned earlier.
These characteristics — combined with the challenges of traditional “MBSE tools” — strongly suggest that Excel is indeed suitable for an MBSE‑style approach in project environments.
Not as a replacement for SysML or existing solutions, but as a complement.
A complement that educates, lowers barriers, and — with further development — may help prevent future project failures.
Rhetorically speaking:
How many job postings for major projects or product management explicitly target system architects?
Most likely none —
even though these projects desperately need exactly what the INCOSE definition describes.
Conversely, no one asks whether a candidate can read a SysML diagram or create a state machine.
But everyone assumes they can use PowerPoint and Excel.
Enough for an introduction 😉.
Concrete examples and implementation approaches will follow in upcoming posts.
To avoid any misconceptions: the Configena framework is not Excel – it goes beyond.
Stay tuned!